
AI Content Footprint: energy, carbon and water of AI content as sourced ranges
A public calculator that estimates the energy, carbon and water behind AI images and video as low, mid and high ranges, with every range tied to its sources and a confidence tier.
Key facts
- 22Cited sourcesListed in the tool's field notes, dataset v0.6.0
- 3Metrics, each a rangeEnergy, carbon and water as low, mid and high
- 3Confidence tiersMeasured, modeled, speculative
Context and problem
Every AI image and video uses electricity, releases carbon and consumes water for cooling, and almost none of that is visible to the person who made it. The numbers that do circulate are often single figures with no source. I built a tool that answers the question honestly: as a range, with the evidence behind it.
Constraints
- Closed models publish nothing. For tools such as Midjourney or GPT Image, there are no measured figures, only estimates.
- The evidence varies in quality. Some figures come from public benchmarks on known hardware; others are derived from comparable systems.
- A visitor does not know the details. Most people cannot say which model, hardware or data centre made their image.
Architecture
How to read it. Read left to right. The inputs pick a per-model energy factor, scaled for image size or video length. That energy range becomes carbon through the grid of the chosen region and water through a published band. The highlighted box is the point of the tool: every result is a low, mid and high range, and every range cites its sources.
The visitor answers four questions: images or video, which tool, how many and how big, and where in the world. Each model has an energy figure per image or per video second, with low, mid and high values, scaled for resolution and duration. Carbon comes from the yearly grid intensity of the chosen region; water comes from a published band per kilowatt-hour. When the visitor does not know the model, the tool uses the full range across all models of that type.
Decisions and trade-offs
- Ranges, never points. Every metric is published as low, mid and high, and the result page lets the visitor drag from best case to worst case.
- Confidence tiers enforced in the data. Each entry is tagged measured, modeled or speculative, and a closed-weight model can never be tagged measured. Every entry needs at least one source.
- Inference only, stated plainly. Training, embodied hardware carbon, networks and data-centre overhead are excluded, so the figures sit at the conservative end, and the methodology page says so.
- No detection claims. The tool estimates “if this were generated with model X”, rather than judging whether content was made with AI.
Governance and cost
The calculation runs in the visitor’s browser: capturing a result sent no request to another server. The methodology names its weakest point, water, which uses a single global band rather than regional data. The dataset is versioned (v0.6.0) and the tool is labeled an open beta.
Outcome
Live and public. The value is the method: a visitor leaves with a range, its assumptions and its sources, not a headline number. I make no claim here about visitor numbers.
What comes next
Regional water data, and live grid intensity in place of yearly averages, which the methodology lists as planned.
Screens
Screens from the working tool. Private details such as amounts, contacts and client posting text are covered or left out. Select a screen to enlarge it.
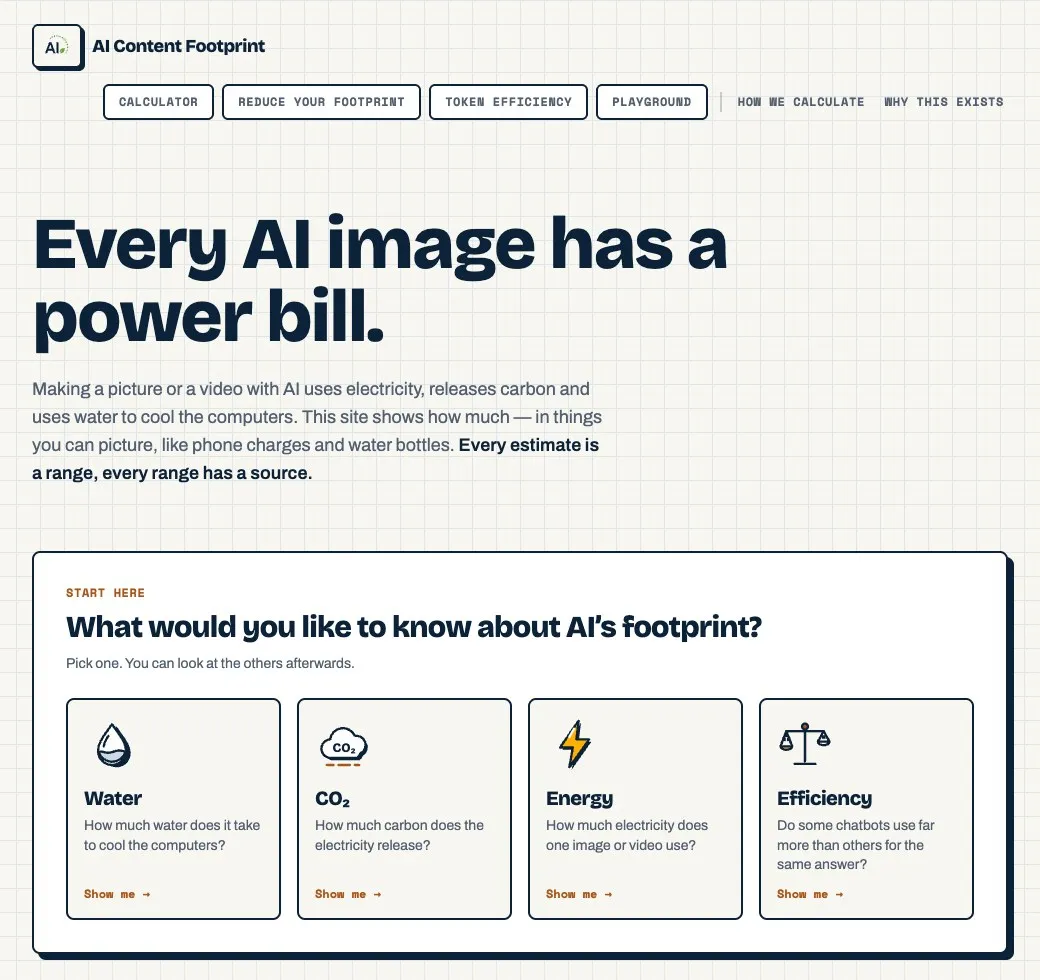
Home every estimate is a sourced range
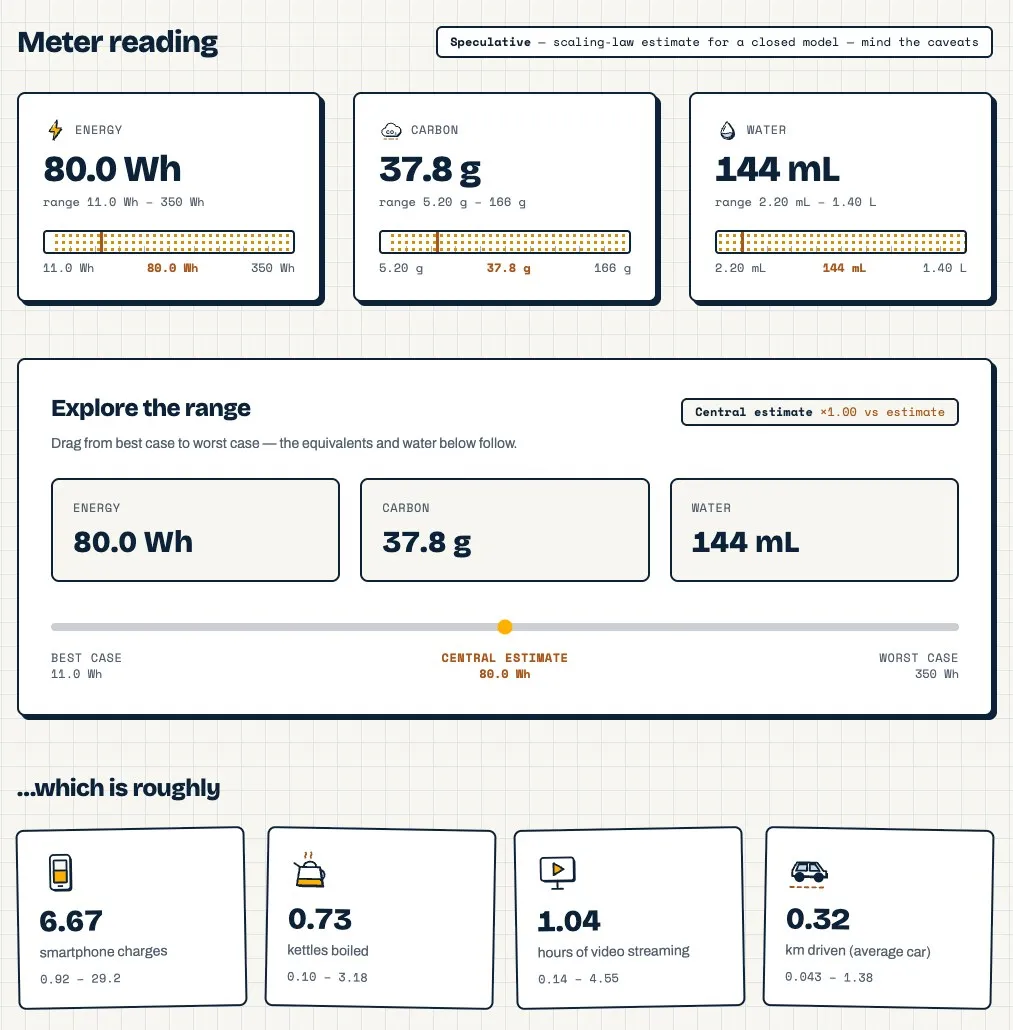
Result energy carbon water ranges and equivalents
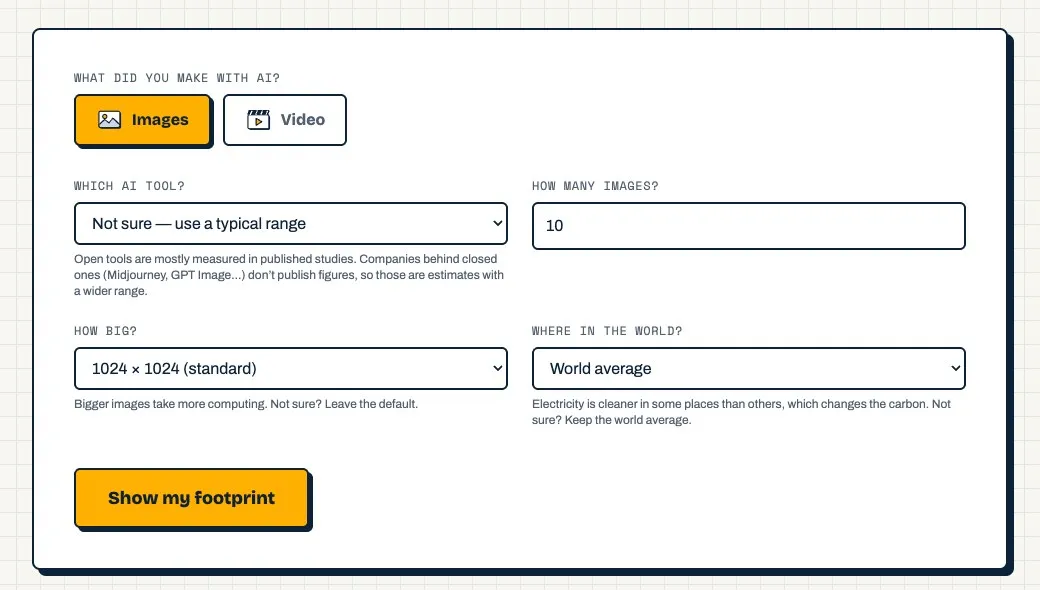
Calculator four questions